Building a Network Monitoring System from Scratch
A step-by-step look at building a monitoring system that gives you real visibility into your network's health, traffic, and events.
Why Build Your Own
Commercial network monitoring tools are expensive and often overkill for a lab or small environment. Building your own gives you deep understanding of how monitoring works and exactly the visibility you need without paying for features you never use.
The Stack
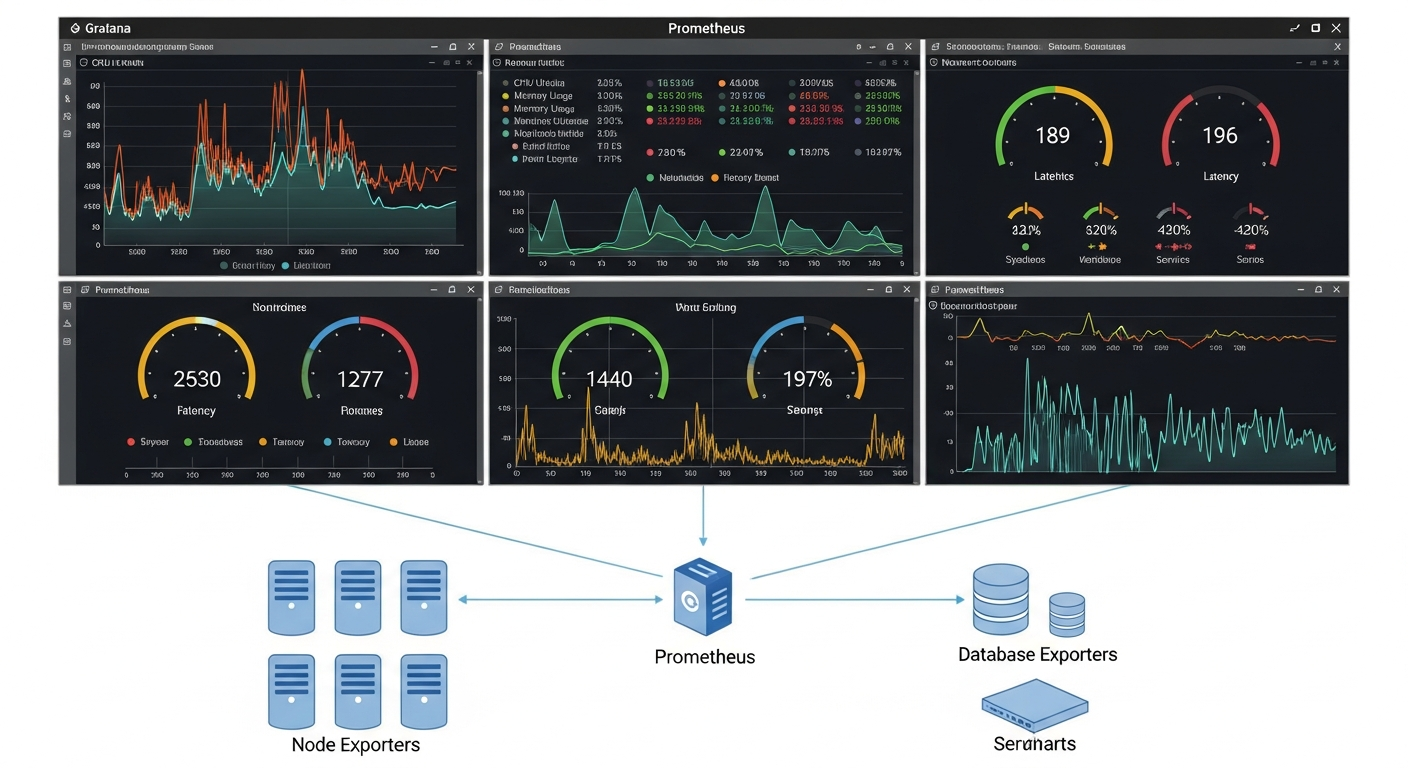
My monitoring stack uses four main components:
SNMP polling with Prometheus SNMP Exporter: Collects interface statistics, CPU and memory utilization, and other metrics from network devices via SNMP. Prometheus scrapes these metrics on a schedule and stores them.
Grafana for visualization: Grafana connects to Prometheus and renders dashboards. You can build exactly the views you need: interface utilization graphs, device health panels, and alert history.
Alertmanager for notifications: When metrics cross thresholds, Alertmanager routes alerts to email or other destinations. A down interface or a device with 95 percent CPU should wake you up.
Syslog collection with Loki: Devices send syslog messages to a central collector. Loki stores them, and Grafana lets you search and correlate logs with metrics.
Setting Up SNMP
First, enable SNMP on your devices with a strong community string or, better, SNMPv3 with authentication and encryption. Then configure the SNMP Exporter with the appropriate module for your device type.
# prometheus.yml
scrape_configs:
  - job_name: 'snmp'
    static_configs:
      - targets:
        - 192.168.1.1  # FortiGate
        - 192.168.1.10  # Cisco switch
    metrics_path: /snmp
    params:
      module: [if_mib]
    relabel_configs:
      - source_labels: [__address__]
        target_label: __param_target
      - target_label: __address__
        replacement: localhost:9116
What to Monitor
Focus first on the things that cause outages or degraded service: interface utilization and error rates, device CPU and memory, BGP session state if applicable, and power supply status. Add more metrics over time as you understand your environment better.
The goal is not to collect everything. It is to make sure you find out about real problems before your users do.