Network Monitoring Tools I Actually Use
A practical look at the monitoring tools running in my homelab and what each one tells me about my network.
Why Monitor
You cannot fix what you cannot see. Without monitoring, you find out about problems when something breaks. With monitoring, you find out about problems before they break anything, and you have data to diagnose the root cause quickly.
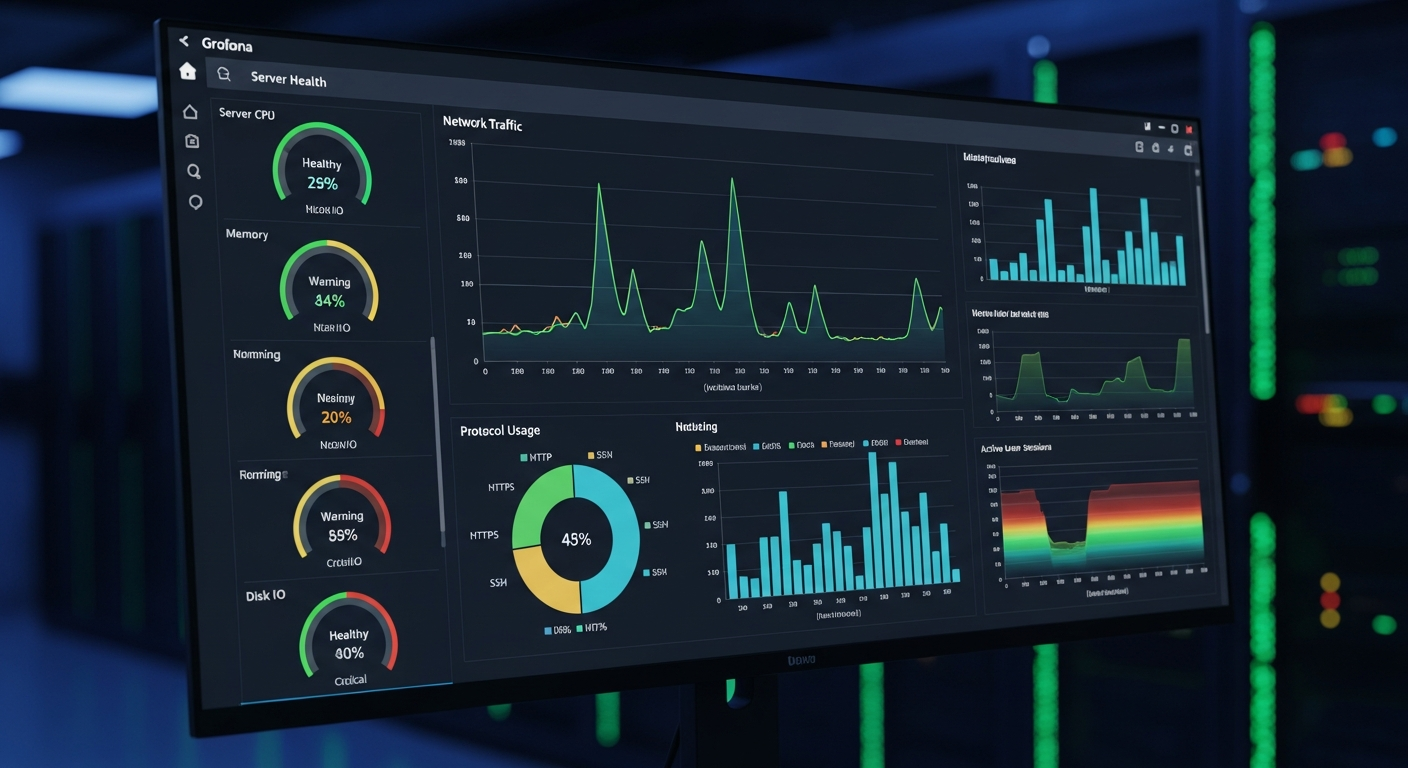
Grafana + Prometheus
This combination is the backbone of my monitoring stack. Prometheus scrapes metrics from exporters running on each server (CPU, memory, disk, network) and stores them in a time-series database. Grafana visualizes those metrics on dashboards.
I have dashboards for per-server resource usage, ZFS pool health, network interface traffic, and UPS status. Each dashboard has alerts configured so I get notified if a metric crosses a threshold (like disk usage exceeding 85% or UPS battery dropping below 50%).
SNMP Monitoring
My switches and FortiGate export metrics via SNMP (Simple Network Management Protocol). I use the Prometheus SNMP exporter to pull these into the same monitoring stack. This gives me visibility into switch port utilization, error counters, and CPU usage on network devices.
SNMP is not the most modern protocol, but it is universally supported by network equipment and provides consistent access to device metrics.
Uptime Monitoring
I use a simple tool that pings every critical device every 60 seconds and alerts if anything goes down. It is basic, but knowing that your DNS server is unreachable before your users tell you is valuable.
Log Aggregation
All syslog data flows to a central log server running rsyslog. I can search across all servers from a single interface, which is essential for troubleshooting issues that span multiple systems.
The Dashboard
My main Grafana dashboard shows a high-level view of the entire lab: all servers, all network devices, storage capacity, and any active alerts. I check it once a day, and if anything is yellow or red, I investigate. This proactive approach has caught failing drives, memory errors, and network issues before they caused outages.